in a previous post, I talked about the procedure I took to find my personal development time when using Pyrocat-HD with FomaPan200 for scanning.
As the sun is shining and fairly contrasty lighting, I made an exposure on Fomapan 200 to test the development time on a real subject.
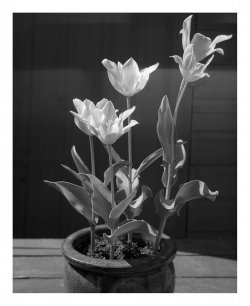
Subject Under Test:- Tulips in plant pot placed infront of garden shed.
I spot metered the dark areas of the soil to the right hand side of the pot and made a note of the reading.
I then metered the petals of the flowers to find the brightest reading and made a note of that reading.
The difference between the two was 6.1 stops.
Placing the darkest area I metered on Zone 3 meant that the brightest area was going to fall on Zone 9 (1 stop above my target of Zone 8).
My initial thought was to do an N-1 development to bring this back to Zone 8 but as this was a test for scanning, I decided to stay with my new development time and go with Zone 9 because I know the way I scan 5x4 negatives, zone 9 is usually just on the edge where I can still retain detail.
This is a straight linear scan in VueScan and then converted to gamma 2.2 with ColorPerfect, converted to sRGB and resized to 1080px on the longest edge.

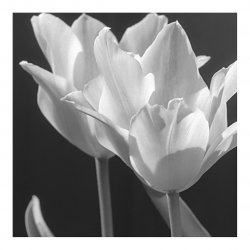
This is a crop of group of Tulips bottom left.

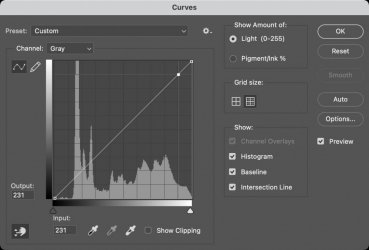
This is a screen shot of the Histogram (3 x 3 average ) in Photoshop showing the brightest part of the petal.

Taking control of the personal development time on the tests I have done so far have certainly produced much better scans with greatly improved tonal separation and detail in the higher values of the greys.
As the sun is shining and fairly contrasty lighting, I made an exposure on Fomapan 200 to test the development time on a real subject.
Subject Under Test:- Tulips in plant pot placed infront of garden shed.
I spot metered the dark areas of the soil to the right hand side of the pot and made a note of the reading.
I then metered the petals of the flowers to find the brightest reading and made a note of that reading.
The difference between the two was 6.1 stops.
Placing the darkest area I metered on Zone 3 meant that the brightest area was going to fall on Zone 9 (1 stop above my target of Zone 8).
My initial thought was to do an N-1 development to bring this back to Zone 8 but as this was a test for scanning, I decided to stay with my new development time and go with Zone 9 because I know the way I scan 5x4 negatives, zone 9 is usually just on the edge where I can still retain detail.
This is a straight linear scan in VueScan and then converted to gamma 2.2 with ColorPerfect, converted to sRGB and resized to 1080px on the longest edge.

This is a crop of group of Tulips bottom left.

This is a screen shot of the Histogram (3 x 3 average ) in Photoshop showing the brightest part of the petal.

Taking control of the personal development time on the tests I have done so far have certainly produced much better scans with greatly improved tonal separation and detail in the higher values of the greys.

